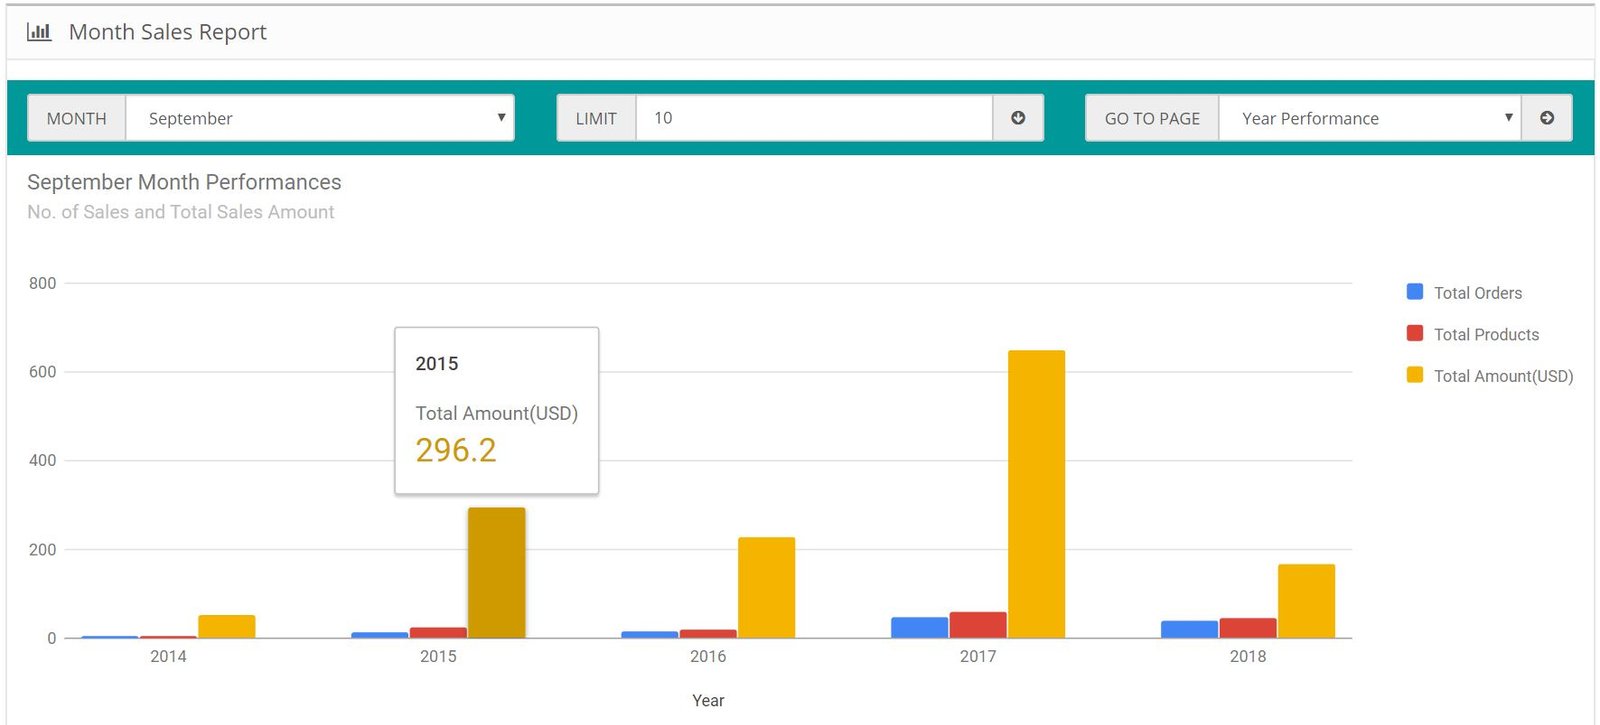
This report shows you data comparison of a particular month over all years of sales. Using this report you can analyze how your store is making sales for a particular month every year and can forecast your future sales and take appropriate decisions to improve the sales higher.
The chart shows the following data
- Total Sales
- Total Orders
- Total Products sold
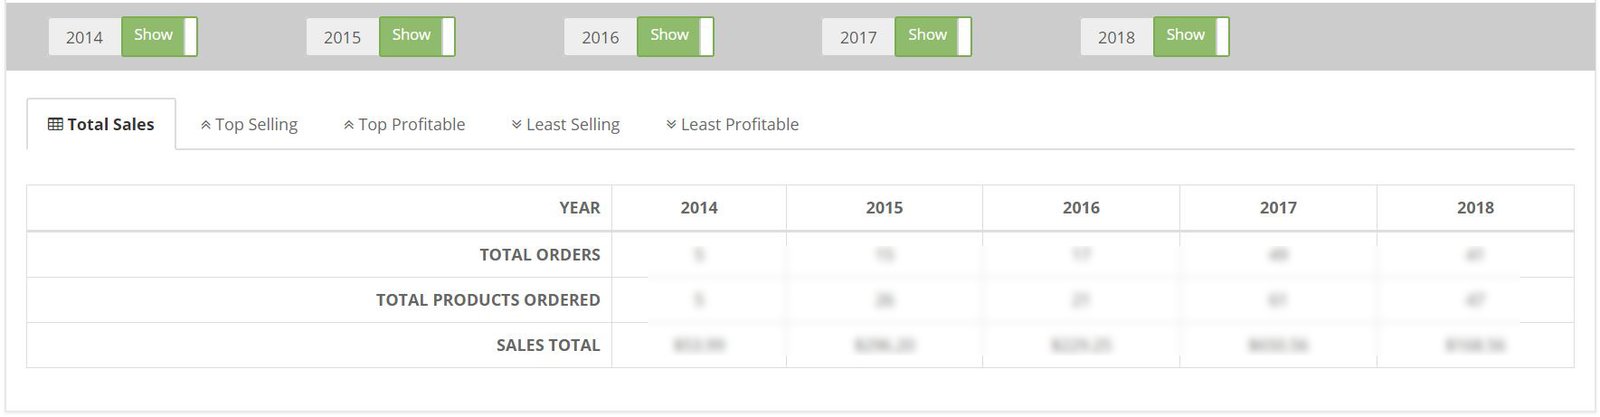
The report also has show / hide buttons for years which you can use it as per your convenience. The button doesn't work on chart and only works on the data table.
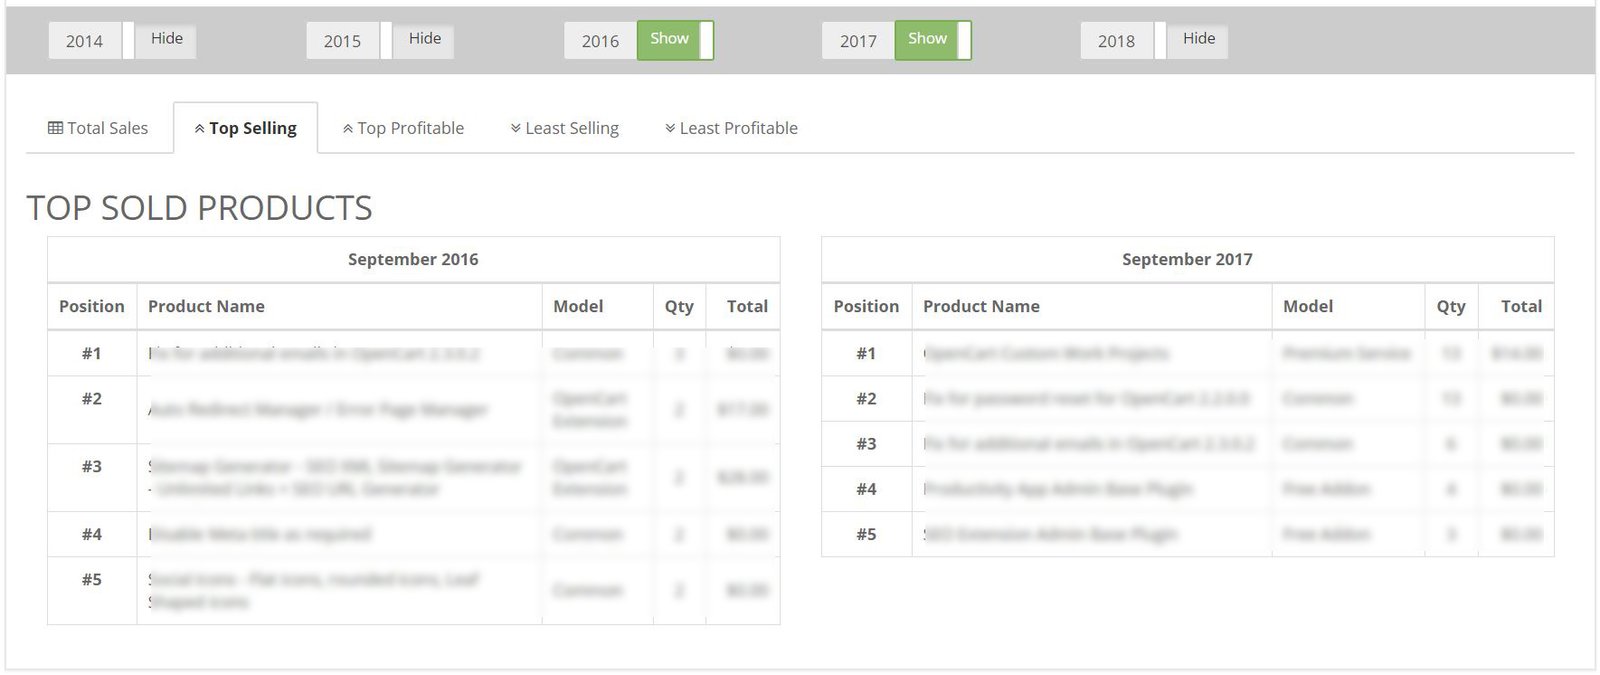
The report also shows you the following for the particular month over all years
- Most sold products
- Most profited products
- Least Sold products
- Least profited products
You can change the number of products to display by setting the LIMIT value at the top and click on the "arrow down" button. By default the Limit value is set to 10.